Sentiment Versus Fundamentals: The Current Case for EM over U.S. Equity
-
Over Q2 and much of Q3, the U.S. thematic sentiment-driven rally broadened from a handful of tech giants to include a large swath of unprofitable stocks.
-
In contrast, equity returns in EM have remained more closely tethered to fundamentals.
-
Better-grounded earnings expectations, and the potential for a pause in monetary tightening, favor equity allocations to EM over the U.S.
Table of contents
Markets, Ben Graham said, work like a voting machine in the short term but like a weighing machine in the long term. Over much of 2023, this aphorism well characterizes the divergent behavior of U.S. and EM equity markets. The U.S. has been caught up by thematic sentiment and thereby resembles a voting machine, while EM has been trading more soberly based on fundamentals, resembling a weighing machine. As a result, fundamentally oriented active investing approaches have performed well in EM but have been challenged in the U.S.
The U.S.: Speculative Sentiment Propels Growth Stocks (Again)
Global equity markets have delivered strong returns year-to-date, with the U.S. leading the way. Although a small group of stocks, often referred to as "the Magnificent Seven" has captured the lion’s share of investor attention, their influence on returns has not been as dominant since late Q2. 1 During the last four months, other high-beta stocks, including companies with negative earnings, have delivered strong returns. Figure 1 demonstrates this trend, showing that the historically large outperformance of high-beta stocks this year is substantial even when we remove the Magnificent Seven from that cohort.
Figure 1: A Historic Year for U.S. High-Beta Stocks
2023 data is year-to-date, as of end-September (not annualized)
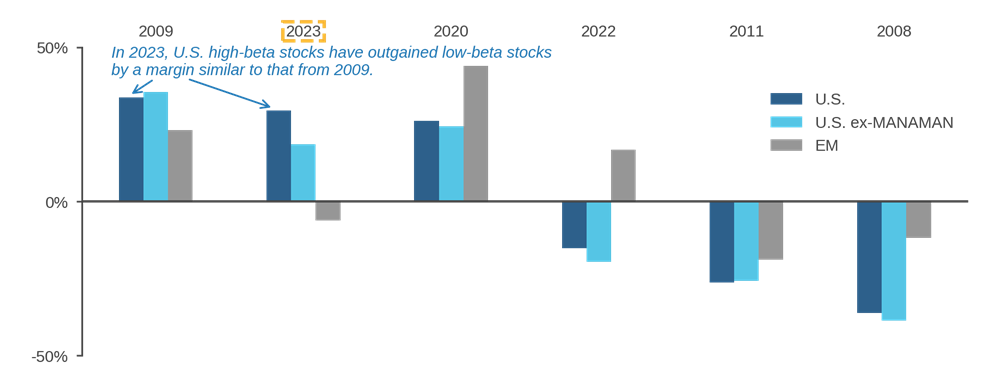
In the past, such strong high-beta performance has coincided with recovery from significant global systemic shocks, such as the Global Financial Crisis (2009) and the onset of the pandemic (2020). However, in the absence of a post-recessionary driver, 2023’s returns to U.S. high-beta stocks are best viewed as a rapid reflation of earnings expectations for tech-oriented growth stocks catalyzed by AI-centric speculation. In a nutshell, among U.S. equities, investors have thrown their weight behind thematic sentiment.
This U.S. investing climate resembles the frothy environment that characterized 2020-21.2 Seen through a factor lens in the left panel of Figure 2, expensive, growth-oriented stocks have delivered strong returns and outperformed cheap stocks by a wide margin. Moreover, the figure also shows robust returns from unprofitable stocks—a group that, in the U.S., features many early-stage, tech-oriented companies.
Figure 2: U.S. – Returns to Fundamentally Oriented Factors
Year-to-date as of Aug 31, 2023
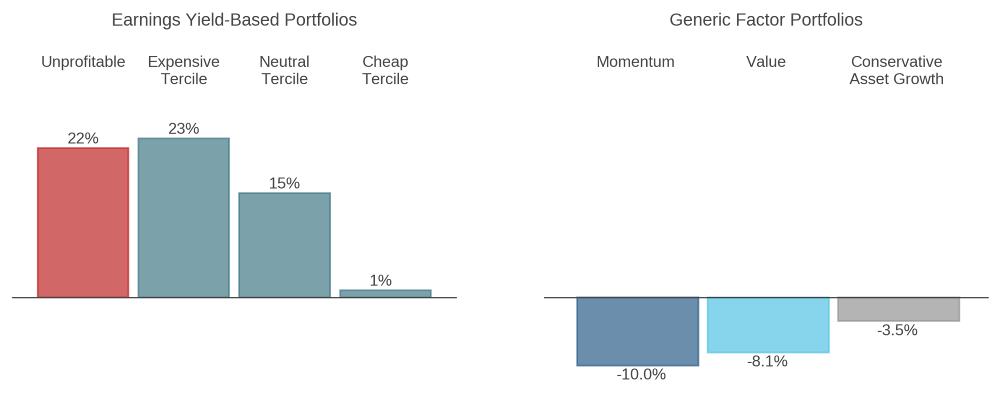
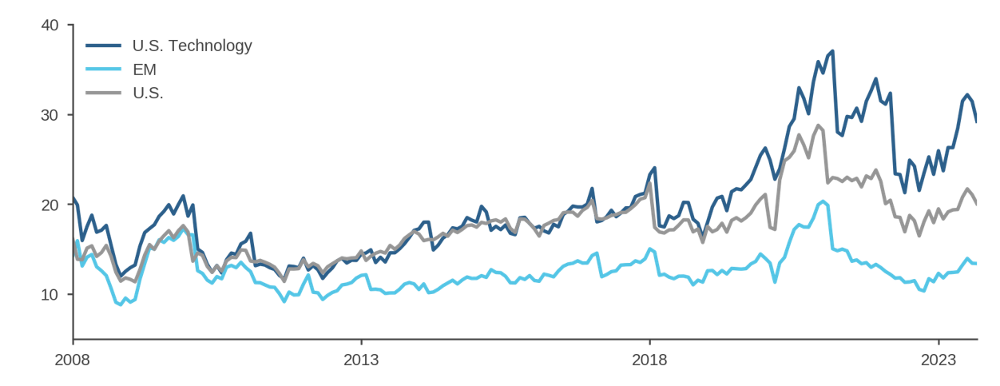
The right panel of Figure 2 adds further detail. It shows that high-momentum stocks underperformed (dark blue). Although momentum delivered strong returns in 2022, it suffered from an abrupt reversal as last year’s losers in IT, consumer discretionary, and communication services have run-up. In addition, the underperformance of companies that invest conservatively (grey) is further evidence that investors pursued aggressive growth. In our view, valuations have become stretched as a consequence of the sentiment-driven rally, notwithstanding the market’s modest retracement in recent weeks (Figure 3). For profitable U.S. tech firms, earnings expectations quickly rebounded to highs from early 2022, prior to the start of monetary tightening. Moreover, pandemic-era tailwinds that helped to elevate those lofty expectations have been fading. Instead, these tech companies face a much higher cost of capital and a challenging operating environment as wage pressures remain strong. Though AI-oriented investments may pay off over the long run for these firms, their current focus is on boosting profitability through cost-cutting measures.3 For unprofitable tech firms, higher interest rates may imply shorter runways to positive earnings than they enjoyed during most of the post-GFC era.4
Figure 3: U.S. Technology Valuations Remain Stretched
Price to Forward Earnings Ratios, 2008 – Sep 2023
EM: A Stronger Tether to Fundamentals
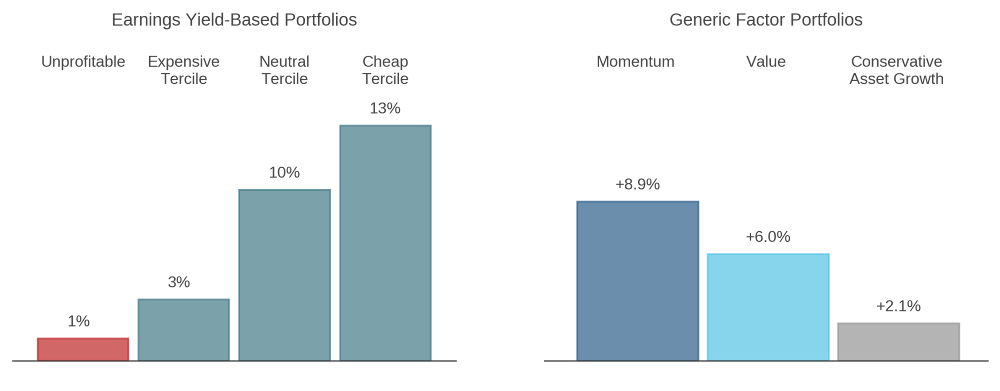
Emerging markets have behaved very differently than the U.S. this year. The left panel of Figure 4 shows that in EM, expensive stocks—both those with earnings and those that are unprofitable—have underperformed the benchmark. In other words, in EM, investors seem to be “weighing” current profits rather than channeling thematic sentiment.5 In fact, the right panel of the figure shows that EM performance drivers were nearly the mirror image of those in the U.S. and that there were positive payoffs from exposure to cheap, conservative companies and positive price momentum.
Figure 4: EM – Returns to Fundamentally Oriented Factors
Year-to-date as of Aug 31, 2023
Explaining the Divergence
Differences in industrial structure have contributed to regional variation in the expression of thematic sentiment. The U.S., as the engine of technological innovation backed by the Silicon Valley ecosystem, provides greater access to stocks in generative AI and related technologies. Furthermore, prominent examples of unprofitable companies transforming into industry leaders, such as Tesla in 2020-21, have left investors, and perhaps even analysts, vulnerable to behavioral biases that can inflame speculation. For example, they may be anchoring current valuations to the frothy price levels and earnings expectations of 2020-21 or overestimating the likelihood that a given unprofitable company will become the next Tesla or Nvidia.6 As a result, we expect AI-driven sentiment to remain overly pervasive in the near-term as investors struggle to differentiate signal from noise around AI, with companies continuing to vie for their attention.
In EM, in contrast, growth-oriented sentiment has been tempered by the flare-up in U.S.-China geopolitical tensions and a slower-than-expected recovery in China. This has shifted the focus among investors to current profits. Moreover, unlike in 2018-20 when EM tech stocks enjoyed multiple expansion in an environment of perceived regulatory permissiveness, more recently the market has become sensitive to potential regulatory pressures, which has helped to keep a lid on multiples.
Growth Equities: Sentiment Not Rates
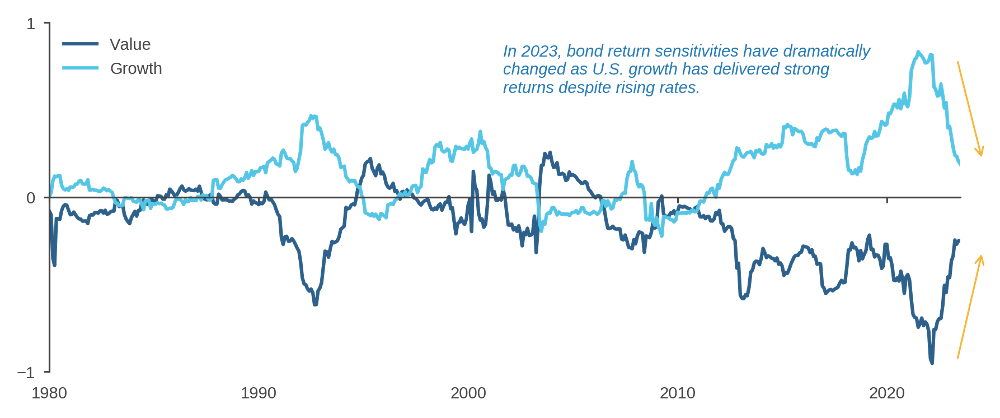
An alternative explanation that has been offered for the U.S. growth stock-led rebound is that anticipation of an end to monetary tightening may be decreasing the discount rate that investors are applying to cash flows. As the argument goes, tech-oriented growthy stocks, and especially currently unprofitable ones, are “longer duration” assets than other equities because their earnings are further in the future. As a result, they might benefit more on a relative basis from falling rate expectations.
As we noted in prior research, however, the empirical relationship between value-growth and interest rates may be an artifact of the 2010s rather than a dependable market feature. 7 In fact, during 2023, rate expectations were rising as growth equities outperformed, contrary to the prediction of DCF-based priors. As a result, growth equities’ measured sensitivity to bonds has sharply fallen. (Figure 5) Based on these observations, we think the case is all the stronger that growth-value dynamics have been influenced by sentiment more than (mechanically) by interest rates.
Figure 5: Growth/Value Sensitivity to 10-year Bond Returns
Bond Betas through Aug 31, 2023
From an allocation perspective, we would view the end of tightening, accompanied by lower inflation, as of particular benefit to emerging economies, through the easing of financial conditions.8 As such, we find the contrast between optimism regarding the U.S. and diffidence towards EM particularly striking.
Conclusion
In the U.S., unprofitable and high-beta tech stocks have, in recent months, joined what was originally a narrower rally led by the Magnificent Seven. In EM, by contrast, investors have been more cautious, and stocks have been tethered more closely to fundamentals. As a result, we view EM equities as appealing relative to the U.S., where valuations remain stretched, and the market seems relatively vulnerable, once again, to a potential shift in sentiment.
